In the Australian water industry, one of the most pressing issues is the struggle to effectively manage and optimise vast networks of infrastructure with limited resources. The challenge lies not only in monitoring and maintaining these assets but also in making sense of the amount of data they generate. This data, often siloed and difficult for stakeholders throughout the organisation to access in real-time, can hinder efforts to predict and prevent system failures, leading to inefficiencies and increased operational costs.
We understand that addressing these challenges requires solutions that simplify data management and enhance decision-making processes. Our latest set of feature updates are designed to simplify how water utilities manage their assets by providing more comprehensive, real-time insights to their operations;
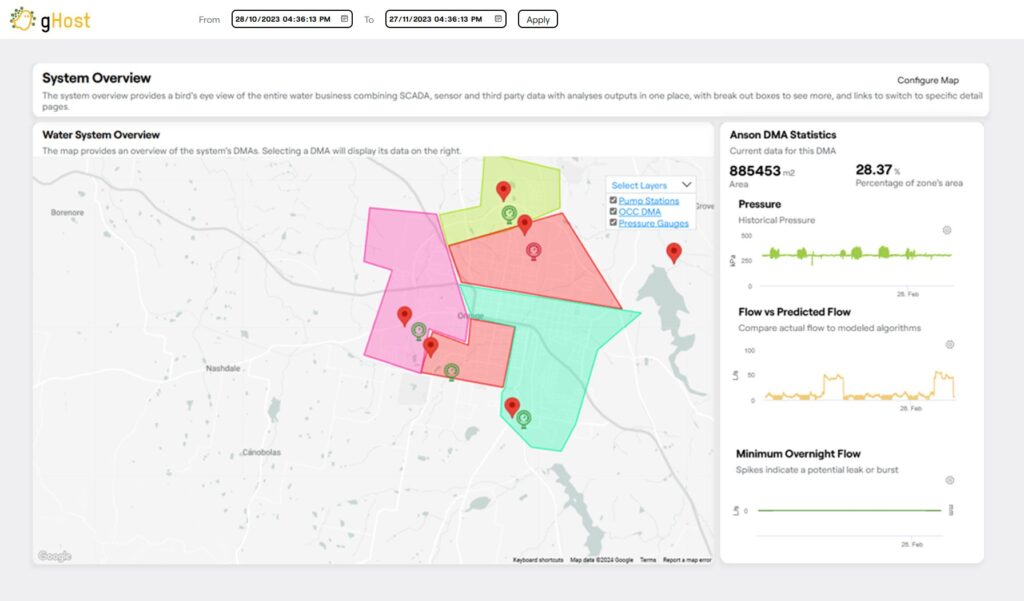
Our new mapping widget is an advancement. It supports polygons and points from a range of diverse sources. We have added customisable status symbols, with interchangeable colours based on the state of an asset – at a glance, users can determine whether something is in good condition, needs attention, or is critical. Everything on our mapping widget can be made clickable, providing detailed information in a dynamic panel that updates based on the asset selected. Users can toggle layers on and off for a comprehensive view of infrastructure. This feature helps in identifying and addressing issues like buried pressure sensors and lost assets, which are often pain points for councils lacking a GIS platform. Operational users do not need to go to the asset team to understand where sensors or equipment might be located; and geographic context can help teams to understand if they are experiencing isolated asset issues, or if there are systemic problems at a site or facility.

gHost now has first-class support for what we call ‘Events.’ Define a Start and End condition for periods you care about:
gHost will automatically track the performance of all relevant assets during those critical windows, helping users to easily assess whether planned or emergency maintenance has had a positive impact.
Our new ‘mass balance’ widget allows users to visualise consumption or generation data across sectors like water or energy, to identify and track which components of a system are having an exaggerated impact on an overall network. This data-backed view supports operational decisions with real-time information, to help pinpoint inefficiencies, optimise resource use, and maintain consistent network performance.
Keep up-to-date with concise recaps of critical information tailored to various needs, whether daily, weekly, or even twice daily. gHost’s enhanced email notifications include summarised counts, averages, and minimum/maximum values, providing a flexible and efficient way to stay informed. These fully responsive reports, based on roll-up metrics, are especially useful for those frequently on the move and away from a desktop.
gHost is built to be exceptionally versatile, allowing users to seamlessly deploy a wide range of essential applications tailored to specific needs. This adaptability ensures that gHost can support a diverse range of operational requirements enabling users to enhance their infrastructure management dynamically. The positive feedback from customers has been encouraging and we are already focused on developing the next set of features to further enhance the user experience. Our goal is to make data management effortless, empowering users to manage and optimise their infrastructure with ease.

For more information about the gHost platform, the solutions it facilitates, and the future of data in environmental monitoring, please contact us using the form below.